Neuromarketing Solution for Biometric Research - NeuroLab by CoolTool | UXReality


NeuroLab Hardware
What is NeuroLab Kit?
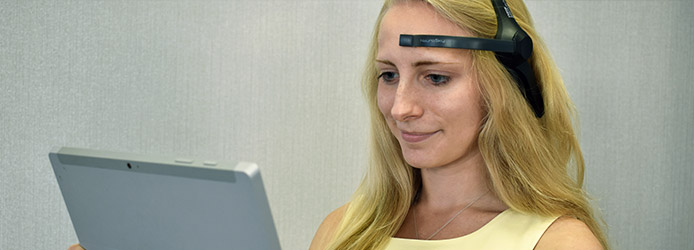
NeuroLab Kit is a set of neuromarketing hardware. It includes Eye Tracker - device that is used to collect eye tracking data, and EEG Headset - device for collecting brain activity data. Choosing NeuroLab Kit you get all that you need to conduct a full-scale NeuroLab projects at CoolTool.
What is the difference between NeuroLab Kit and NeuroLab Kit PRO?
NeuroLab Kit includes Eye Tracker Basic and NeuroLab Kit Pro includes Eye Tracker PRO. If you are going to test long videos (that last much more than 1 minute) we recommend to choose the kit with Eye Tracker PRO. For testing materials that last 1 minute or less NeuroLab Kit with Eye Tracker Basic will be a great choice.
NeuroLab Technologies
What are Automated Methodologies?
NeuroLab automated methodologies are the ready-to-use questionnaire templates for different types of research projects. We have prepared multipurpose questionnaires and integrated them into our system so that you are able to save time preparing the survey.
Furthermore, after the survey is conducted our system will automatically draft a report. Whether you are testing a website, printed or video promotion materials, you can always revert to a ready-to-use solution, instead of drafting new surveys and preparing reports by yourself every single time.
What is NeuroLab Eye Tracking?
Eye Tracking helps you to discover what customers see. It is a technology that helps you to collect data about where consumers were looking at or what they didn't see whatsoever. You can test advertisement, videos, websites, product shelf placement, design layouts, etc. Using hardware minimizes recall errors and the social desirability effect while revealing information conventional research methods normally miss.
What is NeuroLab Emotion Measurement?
Emotion Measurement helps you to discover how customers feel. Using an ordinary webcam and our software you are able to measure consumers' emotions in general as they watch the test materials (especially video) or find out the particular emotion at any particular moment of the test video.
What is NeuroLab Mouse Tracking?
Mouse Tracking helps you discover how customers browse. With help of our software, you can trace how customers navigate on your website with their mouse cursor, where they click, whether they scroll down to the bottom of the page or are searching for necessary information just on the top of the page.
You can also see whether they navigate through several pages of the website or just spent a couple of minutes before leaving, how long do they search for necessary action button or how long they think before clicking on it, etc.
What is EEG (electroencephalogram)?
EEG helps you discover how customers react. Using CoolTool software and EEG hardware will give you understanding into your user’s mental states. EEG enables you to monitor user’s emotional states in real-time. It can show if a customer is frustrated when they experience usability problems and also when they really like a product.
For example, during online shopping, brain activity can be measured with EEG, and participants can comment about their experiences in debriefing interview. It can also be used to assess emotional engagement during interaction with products.
EEG is far less invasive than other neuroimaging methods and modern devices are available at reasonable cost. Order an EEG headset at $199 and you are good to go.
What are Surveys at CoolTool?
Surveys help you discover what customers say. At CoolTool, NeuroLab technologies are fully integrated to the survey and you can cross-analyze survey data from eye tracking, EEG, emotion measurement, mouse tracking.
Also, you can use questionnaire templates, we call them automated methodologies, instead of drafting new surveys and preparing reports by yourself every single time.
What is Implicit Priming Test by CoolTool?
The Implicit Priming Test allows you to identify respondents’ real (unconscious) attitude to the tested objects (brands, persons, etc.). It is designed by CoolTool as a smart combination of the understandable Semantic Priming Task and the sophisticated Implicit Association Test. By comparing the speed of response provision with the combination of objects and various statements or characteristics the system provides you with insights about which characteristic is associated more with Object A or Object B on a subconscious level.
Introduction to NeuroLab
What is NeuroLab?
NeuroLab by CoolTool is a cloud-based solution (software + affordable hardware) for conducting full-cycle automated neuromarketing research. It includes such technologies as Eye Tracking, EEG (brain activity), Mouse Tracking, Emotion Measurement, and Implicit Priming Test. These tools are suitable for testing brand image, printed or digital advertising, website UX/UI, video, product packaging, design, shelf placement, etc.
With NeuroLab all your data, from survey responses to sophisticated insights neuromarketing tools bring you, are together in one place. You can cross-analyze data, create real-time reports and share them with your colleagues.
Can I collect NeuroLab data offline?
Right now the only NeuroLab technology that has an offline option is Survey. You can use it to set up kiosk surveys in stores, restaurants, etc. However, to collect data via eye tracking, EEG, emotion measurement or mouse tracking technologies you need a stable Internet connection.
Our team is working on an offline solution for neuromarketing technologies. If you want to receive this and other updates about our product, please subscribe to our newsletter here.
NeuroLab Results
What is a heatmap?
Heatmap (or heat map) one of the best visualization tools, allowing you to easily monitor the eye-movement of customers. This map is based on the analysis of the number and length of customers’ glances at the particular areas.

The color-coded scheme demonstrates elements which attracted the major respondents’ attention. Red-colored areas depict the highest level of attention concentration, yellow areas stand for slightly less attractive areas while most neglected areas are green-colored. Areas highlighted in red are those at which several respondents looked at for a prolonged period of time or those which one of the respondents attentively examined for a long time. In order to get more data from the heatmap, we advise you to use such statistical index as «Fixation participants count» which shows how many unique respondents looked at the areas you analyzed.
What is an opacity map?
Opacity map is the opposite of the heatmap. The opacity map highlights the "hottest" areas and tones down other areas.

What is a gaze plot?
The gaze plot demonstrates the pattern of respondents’ eye movement. Please take into account that this index shows data related to every particular consumer.
 A circle numbered «1» stands for the first area to which a respondent directed his sight. The bigger the circle, the longer a respondent was looking at the particular area. In case the respondent fixed his sight on the particular area several times within a short period of time, you can consolidate them into one circle, or on the contrary - adjust the tool to show all short fixations of attention on the particular element.
What is the Area of Interest?
Area of interest (AOI) is an area of the picture which you can highlight in order to collect statistics about it. Your logo, brand name, slogan, etc. may serve as an AOI. For the product shelf testing the AOIs are set automatically.

Which statistics are represented in NeuroLab reports?
The list of statistics depends on the type of conducted research. You can analyze EEG Statistics (attention indicator), Emotion Statistics (smile rating), as well as other different indicators in form of charts, graphics, and tables.
Here is the whole list of statistics you can get:
• Fixation count (displays the number of fixations within an AOI).
• Fixation duration (displays how for long (in seconds) respondents looked at the AOI).
• Fixation participants count (how many unique respondents looked at the AOI).
• Time to first fixation (displays how long (in seconds) it took a respondent to look at the AOI for the first time).
• Prior fixations (demonstrates how many times a respondent looked outside of the AOI before looking at it for the first time).
• Observation duration (displays for how long (in seconds) respondents looked at the particular AOI)
• Observation count (displays the number of visits and re-visits to an AOI).
Plus special live website testing statistics:
• Reexamined participants count (shows how many unique respondents referred to the particular AOI more than once).
• Time to click (shows time (in seconds) it took a consumer to click on the AOI for the first time).
• Time to complete (shows how long it took a respondent to complete the task).
• Click participants count (shows a number of respondents who clicked on the particular AOI).
• Time from initial notice to click (shows the timeframe between the moment when a respondent noticed a particular AOI and the moment when he clicked on it).
What does an Emotion Measurement visualization look like?
Respondents’ emotions interpretation provides us data on the whole range of emotions expressed by consumers at any given moment during the testing process: delight, surprise, skepticism, sadness, fear, disgust, negative or neutral attitude.
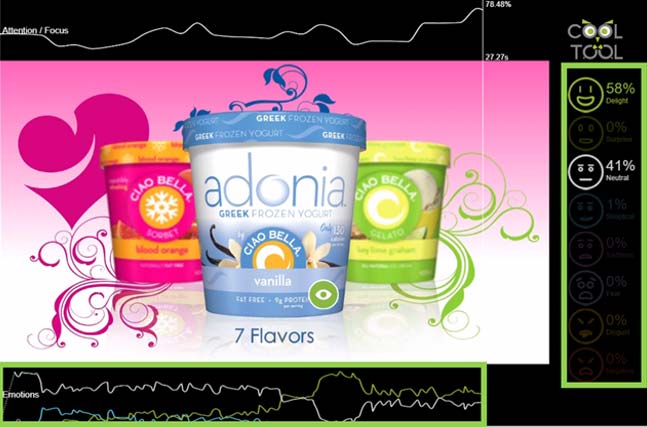
A timeline of all emotions expressed by respondents both on individual and collective levels is located in the bottom part of the report’s slide, while the precise interpretation of respondents’ emotions expressed at any particular moment is located on the left side of the report’s slide and is laid out in the form of “smiles”.
This sign «%» indicates the distribution of emotions’ emergence probabilities in any particular moment. For instance, indexes «58% Delight» and «41% Neutral» mean that the facial expression was recognized rather as happy.
CoolTool emotion measurement solution is based on the theory of “universal emotions”, developed by psychologist Paul Ekman in the 1960s.
What do EEG results look like?
Results of EEG (electroencephalogram) testing are depicted in the form of a curve as demonstrated on the report’s slide below.

The spike of the curve line indicates that the concentration of the respondent’s attention increased which means that at that particular moment of a video or a web-site testing something made the participant more focused (for example, the respondent could try to focus their attention on reading instructions or on searching for an «Order» button).
What do Mouse Tracking results look like?
The movement pattern of the mouse manipulated by a particular respondent is depicted by the orange-colored trace, while every click is highlighted by an orange circle.

The report also contains data on the period between the moment when a respondent noticed a button or other elements of the website and the moment when they clicked on it. Mouse tracking technology is great for studying consumer behavior online.
Why can I view only individual recordings for live websites?
Website usability testing is interactive - i.e. unlike static images or videos, where all respondents interact with the same stimuli. It means that every user navigates the website differently, thus the outcome of the test differs every time as well.
Hardware Shipping Information
Can you deliver hardware to my country?
The complete list of countries to which we supply hardware is available on the order form, accessible by clicking the «Order» button near the device you wish to buy. We deliver our products to numerous countries and we are confident that yours will be on our list.
How much does the hardware delivery to my country cost?
The cost of the hardware delivery varies depending on the country. You can find the price at the completion of the order form.
Does the indicated price of the hardware include taxes?
Some countries will charge duties and taxes on your purchase. These fees vary depending on the country. As such, all duties and taxes are regulated by the individual countries’ tax legislation to which any private company, including ours must follow.
How long does it take to deliver the hardware?
Your order will be sent within 2-3 days. The time of delivery (total number of working days) depends on the geographic location of your country as well as local customs regulations. As a rule, orders from within the USA are delivered in 3-4 days, while global orders are delivered in 7-10 days.
Do you provide a tracking number at the time of hardware order?
Yes, as soon as the device is sent, we provide you with the tracking number for your order.
Can I return the hardware?
Money back guaranteed. We stand by the quality of services we provide. If, for any reason, you are not completely satisfied with our products, you may exchange them or request a full refund within 30 days of the purchase.
Do you provide a warranty for the hardware?
We provide a 12 month warranty on the hardware. We pledge to exchange the purchased device during the first year, if it doesn’t have any visible mechanical damage. Take notice that the warranty is not applicable in the case of the device being broken, scratched or water damaged. The product should be returned together with the original package, supporting documents and a detailed description of the breakage.
Will hardware be compatible with my computer?
The eye tracker and EEG headset have some requirements to PC/laptop. Below you can find out more about them.
If you are going to use an eye tracking device, your PC/laptop must be equipped with:
• Processor: Intel Core i3 or similar
• RAM: at least 1 GB
• Available disk space: at least 1 GB
• USB 3.0 port
• Operating system: Windows 8 / 10
• Preinstalled software: NET Framework 4.5 or later version
• Browser: Internet Explorer 11
• Internet connection: stable, at least 1Mbit/sec.
To use EEG Headset your PC/laptop should meet the following hardware requirements:
• Operating system: 8/10
• Processor: Intel CPU starting from Core i3 or newer (i5/i7)
• Memory: 2GB or more
• Wireless: Bluetooth Version 2.1 w/EDR
The MindWave Mobile headset uses 1 AAA battery as a power source, which provides, on average, 8 hours of operational time.
Pricing Information
How can I pay?
You can pay by credit card or via wire transfer.
Do you provide discounts for academics and students?
We provide academics and students with a 50% discount for our software. This does not apply to hardware, which is provided at the standard price.
What is the price of the hardware?
We sell the hardware at affordable prices. We aim to provide only superb value for money on all our equipment. You can receive more detailed information on hardware prices here.
Is it obligatory to buy hardware for neuromarketing projects’ testing?
The hardware is required if you need to assess the respondents' level of concentration on particular details (EEG, brain waves measurement). You don’t need any special equipment except for a webcam (a built-in laptop one or a separate device if you use a stationary PC) for emotion measurement, eye tracking or mouse tracking.
What are NeuroLab credits and how are they charged?
NeuroLab credits are conventional units of accounting for the number of projects implemented with the application of neuromarketing technologies.
NeuroLab credits are calculated using the following formula:
NeuroLab credits = Q respondent * 1 Neuro test * Q technology
NeuroLab credits are calculated using the following formula:
NeuroLab credits = Q respondent * 1 Neuro test * Q technology
where: "Q respondent" – number of respondents, "1 neuro test" is 1 question from the "neuro tests" section asked with an application of neuro technologies (image or video, or website (live), or product shelf), "Q technology" – number of technologies (during the testing you can use from 1 to 4 NeuroLab technologies).
Under the free-of-charge type of subscription, the number of projects conducted with the application of neuro technologies is limited to 30 NeuroLab credits. It’s up to you how to use these credits. For example:
• 3 neuro tests × 10 respondents × 1 technology = 30 NeuroLab credits
• 1 neuro test × 30 respondents × 1 technology = 30 NeuroLab credits
• 1 neuro test × 10 respondents × 3 technologies = 30 NeuroLab credits
In case you need to create several projects, you can distribute these credits depending on your needs. The main requirement though, is that the total number of credits for all projects should not exceed 30 units. For example:
1st project: 1 neuro test × 10 respondents × 1 technology
2nd project: 2 neuro tests × 5 respondents × 1 technology
3rd project: 1 neuro test × 3 respondents × 3 technologies
The aforementioned limitations are applicable only for projects implemented with the application of neuro-tools via the Talent (free) account.
What determines the price of an individual subscription?
Request a demo and our business development team will give you a comprehensive consultation as well as help find the most advantageous service package for you.
See how CoolTool can help you
We operate by standards of